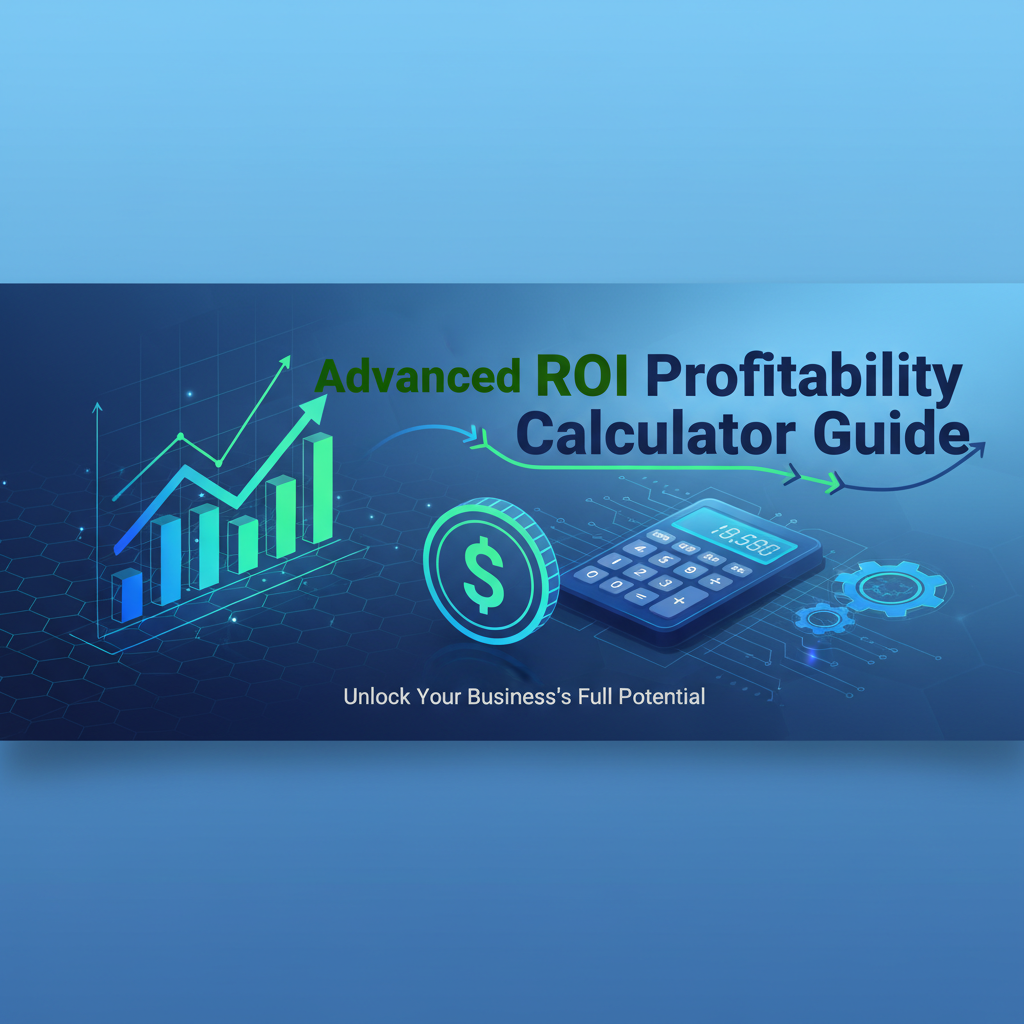
Introduction
Return on Investment (ROI) is one of the most fundamental and widely used financial metrics in business, investing, and marketing. Understanding how to calculate and interpret ROI is essential for making informed financial decisions, whether you’re evaluating stock portfolios, real estate ventures, marketing campaigns, or business projects. This comprehensive guide explores the principles, calculations, and practical applications of ROI analysis, with special emphasis on the powerful concept of annualized ROI.
While basic profit calculations tell you how much money you made or lost, true investment analysis requires deeper insight. Did your investment perform well relative to alternatives? How does a 30% return over three years compare to a 15% return in one year? These questions demand sophisticated metrics that standardize performance across different time periods and investment sizes. Our Advanced ROI & Profitability Calculator provides these critical metrics, enabling data-driven investment decisions.
ROI analysis extends far beyond stock market investing. Real estate professionals use ROI to evaluate property acquisitions. Marketing teams measure campaign effectiveness through marketing ROI (MROI). Business owners assess capital expenditures by calculating equipment and project ROI. Entrepreneurs evaluate startup investments and expansion opportunities. Each application requires understanding the core principles of profitability measurement and comparative analysis.
This guide provides practical frameworks for ROI calculation, interpretation guidelines for different asset classes, common pitfalls to avoid, and strategies for optimizing investment returns. Whether you’re a novice investor or experienced professional, mastering ROI analysis will sharpen your financial decision-making and improve investment outcomes.
Background
The Evolution of ROI as a Financial Metric
Return on Investment emerged as a formalized business metric in the early 20th century, pioneered by DuPont Corporation’s finance executives who needed standardized methods to evaluate divisional performance across their conglomerate. The metric’s simplicity—comparing profit to investment cost—made it universally applicable across industries and investment types.
The basic ROI formula is elegantly simple: ROI = (Net Profit / Initial Investment) × 100. This percentage tells investors how many cents of profit were generated for each dollar invested. A 25% ROI means every dollar invested returned $0.25 in profit. This standardization allows meaningful comparisons between investments of vastly different scales.
However, basic ROI has a critical limitation: it ignores time. A 50% ROI sounds impressive, but the timeframe matters enormously. Did it take one year or ten years to achieve that return? This led to the development of annualized ROI (also called Compound Annual Growth Rate or CAGR), which standardizes returns across different time periods by expressing them as equivalent annual rates.
Understanding Annualized ROI
Annualized ROI uses the compound interest formula to determine what constant annual return would produce the actual total return over the investment period. The formula is: Annualized ROI = ((Final Value / Initial Investment)^(1/Years) - 1) × 100.
This calculation is transformative for investment comparison. Consider two investments: Investment A returns 60% over 5 years (9.87% annualized), while Investment B returns 30% over 2 years (14.02% annualized). Despite Investment A’s higher total return, Investment B delivered superior year-over-year performance. Annualized ROI reveals this truth.
ROI Across Different Asset Classes
Different investment types have characteristic ROI profiles:
Equities (Stocks): Historically average 7-10% annualized returns over long periods, with significant yearly volatility. Individual stocks can deliver anywhere from -100% to several hundred percent returns.
Real Estate: Typically delivers 8-12% annualized returns when including rental income and appreciation. Returns vary greatly by location, property type, and market conditions.
Fixed Income (Bonds): Generally provides 2-6% annualized returns with lower volatility. Government bonds anchor the low end, corporate bonds offer higher yields with increased risk.
Private Equity/Venture Capital: Targets 15-25%+ annualized returns to compensate for illiquidity and high risk. Most individual investments fail, but successful ones deliver exceptional returns.
Marketing Investments: Campaign ROI varies wildly by channel and execution. Digital marketing might deliver 200-500% ROI over months, while brand-building initiatives show returns over years.
Understanding these benchmarks helps investors evaluate whether their returns are competitive within asset classes.
Key Concepts in ROI Analysis
Net Profit: The absolute dollar amount gained or lost (Final Value - Initial Investment). This is your actual wealth change.
Total ROI Percentage: The proportional return relative to investment size ((Net Profit / Initial Investment) × 100). This enables comparison between different-sized investments.
Annualized ROI: The compound annual growth rate that would produce the total return over the investment period. This enables time-normalized comparisons.
Risk-Adjusted Returns: Advanced investors consider risk alongside returns. A 12% return with low volatility may be preferable to 15% with extreme volatility.
Opportunity Cost: The return you could have earned on alternative investments. A 5% ROI may seem positive until you realize index funds returned 10% over the same period.
For comprehensive financial planning that incorporates ROI analysis, consider exploring our Financial Toolbox Overview, which connects multiple calculators for holistic decision-making.
Workflows
Workflow 1: Stock Portfolio Performance Analysis
Objective: Evaluate individual stock and overall portfolio performance to make informed hold/sell/buy decisions.
Step 1: Gather Investment Data
- Record purchase date, quantity, and price per share for each position
- Document current market value or sale price
- Note any dividends received (add to final value)
- Calculate exact holding period in days, months, or years
Step 2: Calculate Individual Position ROI For each stock position:
- Initial Investment = Quantity × Purchase Price
- Final Value = (Quantity × Current Price) + Dividends Received
- Use Advanced ROI & Profitability Calculator
- Input initial investment, final value, and holding period
- Record Net Profit, Total ROI, and Annualized ROI
Step 3: Analyze Performance
- Compare each position’s annualized ROI against market benchmarks (S&P 500 typically 7-10%)
- Identify underperforming positions (annualized ROI below benchmarks)
- Recognize top performers for potential additional investment
- Consider risk factors and future prospects beyond historical ROI
Step 4: Make Strategic Decisions
- Hold: Positions meeting or exceeding benchmark with solid fundamentals
- Sell: Consistent underperformers or positions that have reached target ROI
- Buy More: Top performers with continued growth potential
- Rebalance: Shift capital from underperformers to opportunities
Step 5: Portfolio-Level Analysis
- Calculate total portfolio initial investment (sum of all positions)
- Calculate total current value (sum of all current positions)
- Compute overall portfolio annualized ROI
- Track quarterly to monitor long-term performance trends
Tools Integration: Use our Investment Growth & Compound Interest Calculator to project future portfolio values based on historical annualized returns.
Workflow 2: Marketing Campaign ROI Optimization
Objective: Measure marketing campaign profitability and optimize budget allocation across channels.
Step 1: Define Campaign Parameters
- Campaign cost: Include ad spend, creative development, tools, and labor
- Revenue attribution: Track sales directly attributable to the campaign
- Timeframe: Record campaign start and end dates
- Channel: Identify specific marketing channel (social, email, content, etc.)
Step 2: Calculate Campaign ROI For each campaign:
- Initial Investment = Total campaign costs
- Final Value = Attributed revenue
- Campaign duration = Days or months from start to finish
- Calculate using Advanced ROI & Profitability Calculator
- Focus on both total ROI and annualized ROI
Step 3: Channel Comparison
- List all campaigns with their annualized ROI
- Rank channels by performance
- Identify patterns (email might excel at low cost, social at scale)
- Consider customer lifetime value (CLV) for fuller picture
Step 4: Budget Reallocation
- Increase spending on highest annualized ROI channels
- Test low-performing channels with different approaches before abandoning
- Calculate break-even ROI (minimum ROI needed to cover costs)
- Set ROI targets for future campaigns based on historical data
Step 5: Continuous Optimization
- Run A/B tests on high-performing channels
- Track ROI monthly to identify seasonal patterns
- Document learnings from failed campaigns
- Create ROI benchmarks for each channel type
Real-World Example: An e-commerce company tracked three marketing channels over six months:
- Email marketing: $3,000 cost, $18,000 revenue = 500% ROI (1,730% annualized)
- Social media ads: $12,000 cost, $30,000 revenue = 150% ROI (410% annualized)
- Content marketing: $8,000 cost, $22,000 revenue = 175% ROI (493% annualized)
While social ads delivered the most absolute revenue, email delivered the highest ROI efficiency. The company doubled email budget and optimized social campaigns, increasing overall marketing ROI by 35%.
Workflow 3: Real Estate Investment Comparison
Objective: Evaluate multiple real estate investment opportunities to select the most profitable option.
Step 1: Define Investment Parameters For each property:
- Purchase price + closing costs = Initial investment
- Current market value (or projected sale price) = Final value
- Holding period in years
- Net rental income received (add to final value for rental properties)
Step 2: Calculate Property-Specific ROI Using Advanced ROI & Profitability Calculator:
- Enter total initial investment (purchase + improvements + costs)
- Enter final value (sale price or current value + total net rental income)
- Enter holding period in years
- Record annualized ROI for each property
Step 3: Comprehensive Comparison Create comparison matrix:
- Property location and type
- Total net profit
- Total ROI percentage
- Annualized ROI (critical for different holding periods)
- Risk factors (market stability, maintenance costs)
Step 4: Risk Assessment Higher ROI often means higher risk:
- Market volatility in the area
- Property condition and future maintenance costs
- Tenant reliability for rental properties
- Liquidity (how quickly can you sell if needed)
Step 5: Investment Decision Select properties based on:
- Highest risk-adjusted annualized ROI
- Diversification across property types and locations
- Alignment with investment timeline and goals
- Cash flow needs (rental income vs. appreciation)
Tools Integration: For properties with ongoing mortgage payments, use our Advanced Loan & Mortgage Calculator to understand true carrying costs and their impact on ROI.
Workflow 4: Business Project Evaluation
Objective: Determine whether a business project or capital expenditure will deliver adequate returns.
Step 1: Project Cost Analysis
- Equipment/technology costs
- Implementation and training expenses
- Ongoing operational costs
- Opportunity cost of capital
Step 2: Revenue Impact Projection
- Increased revenue from new capabilities
- Cost savings from efficiency gains
- Reduced expenses from automation
- Timeline to break-even
Step 3: ROI Calculation
- Initial Investment = Total upfront costs
- Final Value = Initial investment + total net benefits over project life
- Time period = Expected project lifespan
- Calculate annualized ROI
Step 4: Threshold Evaluation
- Compare annualized ROI to company’s cost of capital
- Projects should exceed cost of capital by margin for risk
- Consider strategic value beyond pure ROI
- Evaluate against alternative projects competing for budget
Step 5: Approval and Tracking
- Approved projects: Annualized ROI exceeds threshold
- Post-implementation: Track actual vs. projected ROI
- Course-correct if actual performance lags projections
- Learn from variance for future project estimates
Comparisons
ROI vs. Return on Equity (ROE)
ROI measures the return on a specific investment, answering “How well did this particular investment perform?”
ROE measures how effectively a company generates profits from shareholders’ equity, answering “How efficiently is management using shareholder capital?”
When to use ROI: Evaluating specific investments, projects, or campaigns.
When to use ROE: Evaluating company management effectiveness or comparing companies within an industry.
ROI vs. Internal Rate of Return (IRR)
ROI calculates returns based on initial and final values, suitable for simple investment scenarios.
IRR calculates the discount rate that makes the net present value of all cash flows equal to zero, ideal for complex projects with multiple cash inflows and outflows over time.
When to use ROI: Single investment with clear entry and exit points.
When to use IRR: Projects with multiple cash flows at different times (e.g., real estate with ongoing rental income).
ROI vs. Net Present Value (NPV)
ROI expresses returns as a percentage, useful for comparing efficiency.
NPV expresses returns in absolute dollars after discounting future cash flows to present value, useful for determining whether a project adds value.
When to use ROI: Comparing investments of similar size or when focusing on efficiency.
When to use NPV: Evaluating whether a project’s absolute value exceeds its cost, especially with complex cash flows.
Total ROI vs. Annualized ROI
Total ROI shows the complete percentage return over the entire holding period.
Annualized ROI shows the equivalent constant annual return that would produce the total return.
When to use Total ROI: Comparing investments held for the same duration.
When to use Annualized ROI: Comparing investments held for different durations—this is essential for fair comparison.
Simple ROI vs. Risk-Adjusted ROI
Simple ROI measures returns without considering volatility or risk.
Risk-Adjusted ROI (Sharpe Ratio, Sortino Ratio) factors in volatility, rewarding consistent returns and penalizing volatility.
When to use Simple ROI: Basic profitability screening.
When to use Risk-Adjusted ROI: Sophisticated portfolio management where stability matters as much as returns.
Best Practices
1. Always Consider Time in ROI Calculations
Never compare total ROI percentages for investments held over different periods. A 20% return in 6 months far exceeds a 20% return over 3 years. Always use annualized ROI for cross-investment comparisons. Our Advanced ROI & Profitability Calculator automatically computes annualized returns, ensuring fair comparisons.
2. Include All Costs and Returns
Incomplete ROI calculations lead to flawed decisions. Include:
- Costs: Purchase price, transaction fees, taxes, maintenance, opportunity costs
- Returns: Sale proceeds, dividends, interest, rental income, tax benefits
For example, a stock that appreciated 15% but paid 2% annual dividends for 3 years actually returned 21% total (approximately 6.6% annualized). Omitting dividends understates performance.
3. Benchmark Against Relevant Alternatives
ROI is meaningless without context. A 6% annualized return might be excellent for low-risk bonds but disappointing for stocks. Always compare your ROI against:
- Historical performance of the asset class
- Market index returns (S&P 500, real estate indices)
- Returns on alternative investments you could have chosen
- Your required rate of return based on risk tolerance
4. Account for Risk Appropriately
Higher returns typically come with higher risk. A 30% ROI on a speculative cryptocurrency is not directly comparable to a 10% ROI on blue-chip stocks—the risk profiles are entirely different. Consider:
- Volatility of returns
- Probability of total loss
- Liquidity (can you exit quickly if needed?)
- Correlation with other investments
For comprehensive risk assessment, diversify across multiple asset classes using tools like our Investment Growth & Compound Interest Calculator to model different portfolio scenarios.
5. Use Consistent Time Periods for Comparisons
When comparing multiple investments, standardize your time periods. Annualized ROI does this automatically, but ensure all calculations use the same formula. Different calculators may use slightly different methodologies (simple vs. compound growth), potentially causing misleading comparisons.
6. Document Assumptions and Projections
For future-looking ROI calculations (evaluating potential investments), document all assumptions:
- Expected growth rates
- Cost estimates
- Risk factors
- Market conditions
- Exit strategies
Review these assumptions periodically and adjust projections based on actual performance. This discipline improves future investment analysis accuracy.
7. Separate Skill from Luck
Short-term exceptional returns may result from luck rather than skill. A cryptocurrency that returned 500% in three months doesn’t mean you have a replicable strategy. Evaluate:
- Consistency across multiple investments
- Performance across different market conditions
- Whether results align with your analysis or happened randomly
8. Consider Tax Implications
ROI calculations should reflect after-tax returns for accurate decision-making. Different investments have different tax treatments:
- Long-term capital gains (held over 1 year) taxed at favorable rates
- Short-term gains taxed as ordinary income
- Tax-advantaged accounts (IRA, 401k) defer or eliminate taxes
- Real estate has unique depreciation benefits
Calculate ROI on an after-tax basis to reflect actual wealth creation.
9. Reinvest Returns Strategically
Compound growth accelerates wealth accumulation. An investment returning 10% annually grows 2.6× over 10 years with reinvestment versus only 2× without. Use our Investment Growth & Compound Interest Calculator to visualize the power of reinvestment over time.
10. Review and Rebalance Regularly
Investment performance changes over time. Quarterly or annual ROI reviews help you:
- Identify underperforming investments to exit
- Recognize opportunities to increase positions in strong performers
- Rebalance portfolio to maintain desired risk levels
- Adjust strategy based on life changes or market conditions
Case Study
Case Study: Tech Startup Marketing Budget Optimization
Background: A growing SaaS startup with $500,000 annual marketing budget was struggling with customer acquisition costs. The CMO needed to determine which marketing channels delivered the best ROI to optimize budget allocation for the following year.
Challenge: The company ran campaigns across six channels with different costs, timeframes, and customer lifetime values:
- Google Search Ads (running 12 months)
- Social Media Advertising (running 8 months)
- Content Marketing (running 12 months)
- Email Marketing (running 6 months)
- Partnership Marketing (running 10 months)
- Event Sponsorships (running 4 months)
Each channel had different investment levels and attribution models, making direct comparison difficult without standardized metrics.
Approach: The marketing team implemented a comprehensive ROI analysis workflow:
Phase 1: Data Collection (Month 1)
- Compiled total costs for each channel (ad spend, creative, tools, labor)
- Attributed revenue to each channel using multi-touch attribution
- Recorded exact campaign start and end dates
- Calculated customer lifetime value (CLV) for cohorts from each channel
Phase 2: ROI Calculation (Month 2) Using the Advanced ROI & Profitability Calculator, they calculated for each channel:
Google Search Ads:
- Investment: $120,000 (12 months)
- Revenue: $480,000
- Total ROI: 300%
- Annualized ROI: 300%
Social Media Ads:
- Investment: $90,000 (8 months)
- Revenue: $225,000
- Total ROI: 150%
- Annualized ROI: 243%
Content Marketing:
- Investment: $80,000 (12 months)
- Revenue: $280,000
- Total ROI: 250%
- Annualized ROI: 250%
Email Marketing:
- Investment: $25,000 (6 months)
- Revenue: $175,000
- Total ROI: 600%
- Annualized ROI: 1,925%
Partnership Marketing:
- Investment: $100,000 (10 months)
- Revenue: $300,000
- Total ROI: 200%
- Annualized ROI: 259%
Event Sponsorships:
- Investment: $85,000 (4 months)
- Revenue: $170,000
- Total ROI: 100%
- Annualized ROI: 344%
Phase 3: Analysis (Month 2-3) The annualized ROI revealed surprising insights:
- Email marketing dramatically outperformed on efficiency despite lower absolute revenue
- Event sponsorships, while expensive, delivered strong short-term returns
- Google Search Ads were solid but not exceptional
- Social media ads underperformed when normalized for time
The team also analyzed customer quality:
- Email customers had 150% higher lifetime value than social media customers
- Partnership customers had the highest retention rates
- Search ads brought most qualified leads
Phase 4: Strategic Reallocation (Month 3-4) Based on ROI analysis, they restructured the budget:
Original Budget:
- Google Search Ads: $120,000 (24%)
- Social Media Ads: $90,000 (18%)
- Content Marketing: $80,000 (16%)
- Email Marketing: $25,000 (5%)
- Partnership Marketing: $100,000 (20%)
- Event Sponsorships: $85,000 (17%)
Optimized Budget:
- Google Search Ads: $100,000 (20%) - slight decrease
- Social Media Ads: $50,000 (10%) - significant decrease, focus on top platforms
- Content Marketing: $100,000 (20%) - increase for long-term SEO value
- Email Marketing: $75,000 (15%) - tripled due to exceptional ROI
- Partnership Marketing: $125,000 (25%) - increased for high-CLV customers
- Event Sponsorships: $50,000 (10%) - selective high-value events only
Results: (Year 2 vs. Year 1)
- Overall marketing ROI increased from 279% to 387% (38% improvement)
- Customer acquisition cost decreased by 28%
- Customer lifetime value increased by 22% (better channel mix)
- Total revenue from marketing-attributed customers increased by 52%
- Marketing team efficiency improved with focused effort on proven channels
Key Learnings:
- Annualized ROI was critical: Without time-normalization, they would have over-invested in absolute-revenue champions rather than efficiency winners
- Channel quality matters: Email and partnerships delivered customers with higher LTV, making their true ROI even better
- Testing continues: They reserved 10% of budget for testing new channels, measured against ROI benchmarks
- Regular review: Quarterly ROI reviews allowed agile reallocation toward emerging opportunities
Tools Integration: The team used Advanced ROI & Profitability Calculator for channel ROI, Interactive Savings Goal Calculator to set quarterly revenue targets, and built forecasts using Investment Growth & Compound Interest Calculator to model growth trajectories.
This case demonstrates how rigorous ROI analysis, particularly annualized ROI for different time periods, can transform marketing effectiveness and drive business growth.
Call to Action
Ready to master investment analysis and make data-driven financial decisions? Start by calculating the ROI of your current investments using our Advanced ROI & Profitability Calculator. Whether you’re evaluating stocks, real estate, marketing campaigns, or business projects, understanding your true returns is the foundation of wealth building.
Take Action Today:
-
Analyze Your Portfolio: Calculate annualized ROI for all your current investments to identify top performers and underperformers. Make informed hold/sell/buy decisions based on standardized metrics.
-
Optimize Marketing Spend: Measure campaign ROI across all channels and reallocate budget to your most profitable marketing investments. Transform your marketing from cost center to profit engine.
-
Evaluate New Opportunities: Before committing capital to any investment, calculate projected ROI and compare against benchmarks. Ensure every dollar works toward your financial goals.
-
Build Comprehensive Financial Plans: Combine ROI analysis with our complete suite of financial tools:
- Use Investment Growth & Compound Interest Calculator to project long-term wealth accumulation
- Calculate borrowing costs with Advanced Loan & Mortgage Calculator
- Plan savings goals using Interactive Savings Goal Calculator
- Review Financial Toolbox Overview for holistic planning strategies
-
Share with Your Team: If you’re managing business or marketing investments, share ROI calculations with stakeholders to align everyone around data-driven decision-making.
The difference between average and exceptional investors isn’t luck—it’s systematic analysis and disciplined decision-making. ROI calculation is your compass for navigating investment decisions. Start measuring, comparing, and optimizing your returns today.
Bookmark the Advanced ROI & Profitability Calculator for quick access whenever you need to evaluate investment performance. Your future wealth depends on the decisions you make today—make them with confidence, backed by accurate ROI analysis.
Article published: November 3, 2025 | Part of Gray-wolf Tools Financial Education Series
Additional Resources
- Financial Best Practices Guide - Comprehensive financial planning strategies
- Investment Growth & Compound Interest Calculator - Model long-term growth scenarios
- Interactive Savings Goal Calculator - Plan systematic savings strategies
- Advanced Loan & Mortgage Calculator - Understand borrowing costs and debt management
External References:
- Investopedia: Return on Investment (ROI) - Comprehensive ROI encyclopedia
- Harvard Business Review: The New Science of Customer Emotions - Marketing ROI context
- SEC Office of Investor Education - Official investment guidance
- Corporate Finance Institute: CAGR Formula - Annualized ROI technical details